
Pneumonia detection from chest X-Rays using deep neural networks
Published:
Introduction
Algorithm Description
1. General Information
Intended Use Statement: Our model will be used by radiologist to reduce their time by prioritizing scans which are likely to have pneumonia.
Indications for Use: Our model will work on X-rays of the chest with Modality ==’DX’ and PatientPosition ==’AP’ or PatientPosition ==’PA’. Furthermore, the age and gender range of our model should be 20-75 years and mostly males to get the best performance.
Device Limitations: Algorithm is not perfect and may not work accuractely where the X-ray images are very similar to non-peumonia.
Clinical Impact of Performance: Our model results in around 37% precision for 37% recall. If we want to increase recall we will loose on precision as shown in plots in sections. A false positive by our model will only cause the image to be diagnosed early by the radiologist and will not have an impact on the patient. A false negative on the other hand may significantly delay the report generation by the radiologist for a patient as their x-ray will always be de-prioritized in the queue.
2. Algorithm Design and Function
DICOM Checking Steps: Modality, patient position and body part examined has been checked.
The model will work if the following conditions are met:
- BodyPartExamined ==’CHEST’
- Modality ==’DX’
- PatientPosition ==’AP’ or PatientPosition ==’PA’
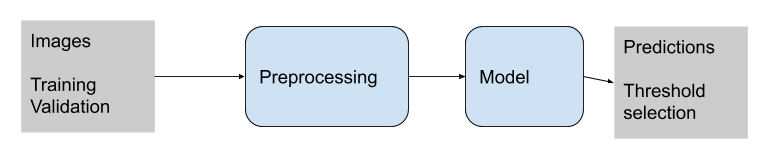
Preprocessing Steps: Rescale image intensity by 1/255. Our code uses a mean of 0 and std. dev. of 1 to normalize the image. This is an identity function is should not change the image at all, but we have it in the code for future iterations where we may want to change the mean and std.
CNN Architecture: VGG16 –> Dense(1024) –> Dense(512) –> Dense(256) –> Dense(1)
3. Algorithm Training
Parameters:
- Types of augmentation used during training - Horizontal Flip, Shear=0.1, Zoom=0.1, height_shift_range= 0.1, width_shift_range=0.1,
- Batch size=8
- Optimizer learning rate=1e-4
- Layers of pre-existing architecture that were frozen: 1 to 17
- Layers of pre-existing architecture that were fine-tuned: None
- Layers added to pre-existing architecture: Dense layers 1024, 512, 256, 1
model architecture, weights and history are stored in files with suffix v5. E.g. my_model_v5.json for model architechture
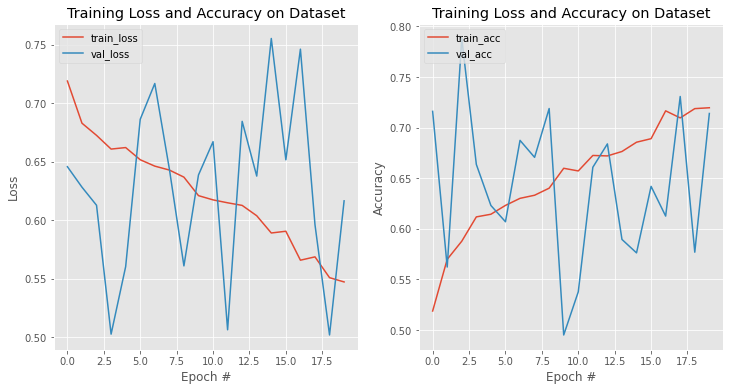
We track the val_loss during model training and do early stoppng with patience 10.

Final Threshold and Explanation: The threshold was chosen at 0.6 based on the precion-recall curve as well as the F1-threshold curves. 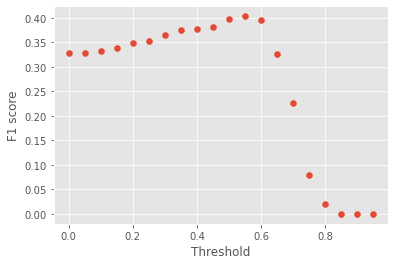
4. Databases
(For the below, include visualizations as they are useful and relevant)
Description of Training Dataset: Original data had 112,000 chest x-rays with disease labels acquired from 30,000 patients. It was taken from NIH Chest X-ray Dataset
The NIH dataset was created by using keywords of the eight common thoracic pathology diseases. This was further expanded using NLP techniques.
One main benefit of using NLP to generate X-ray labels is that this can be automated to get a large dataset. Based on the high (more than 90%) precision, recall, and F1 score of the methodology of generating labels on a smaller gold standard dataset the methodlogy for generating labels appears to be robust.
The shortcoming of this approach is that NLP based methods are often not perfect and are likely to have noise especially for cases where the radiologist reports are ambigous or do not have the required terms. Automated application of NLP method for generated the dataset might actually amplify the noise in the dataset, especially if the noise is biased towards a specific disease. Finally, another limitation of NLP based approach is that is not a gold standard as based on an X-ray a patient may or may not have Pneumonia even if the radiologist report says so. However, we use this dataset with the assumption that with enough silver standard dataset we can generate a pretty strong model.
We splitted the data into 80/20 for training and validation set while doing stratification on Penumonia label.
Further, for training set, we used all the instances with Pneumonia=1 and downsampled Pneumonia=0 to ensure an 50/50 distribution of labels (see below).
Data distribution:
| No | 1145 |
| Yes | 1145 |
The distribution of age and gender in the training and validation data is as follows: 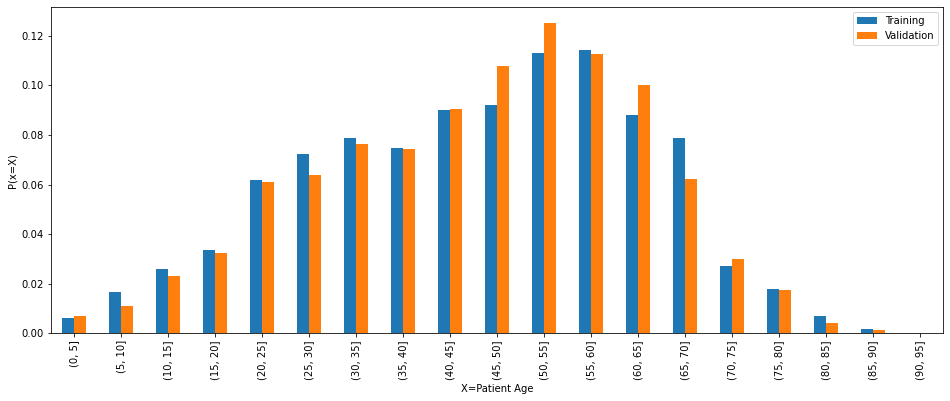
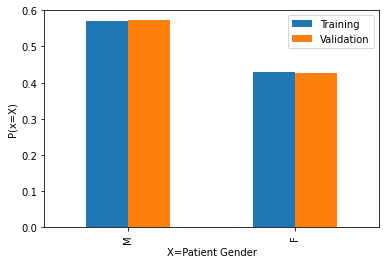
The age and gender distribution is quite similar in both the training and validation data and it matches the distribution of the overall data.
Description of Validation Dataset:
For validation set, we up-sampled the negative labels to have an 80/20 split for negative and positive labels, which resembles a real world setting. 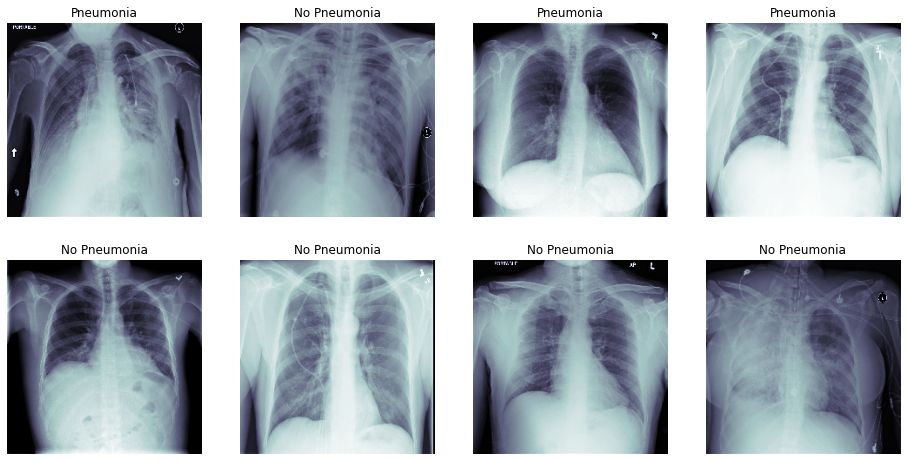
No 1144 Yes 286
5. Ground Truth
In the used dataset the disease names were generated using text mining. See paper
This method utilizes presence of words referring to the disease and also handle negation and uncertainity using text processing approaches.
Errors in wrong diagnosis mentioned in the report are likely to creep into these text mining reports as well as errors in hand crafted rules which usually have high precision but low recall.
6. FDA Validation Plan
Patient Population Description for FDA Validation Dataset: Our training dataset was trained on data with following demographic distributions:
Gender:
Overall Pneumonia M 63340 838 F 48780 593 <img src="/assets/gender_dist.png">
Larger data is available for Male compared to female (60% versus 40%).
Hence, model may perform better for male gender compared to female.
Age groups:
Overall Pneumonia (0, 10] 1803 41 (10, 20] 6009 95 (20, 30] 13441 200 (30, 40] 16702 247 (40, 50] 22101 250 (50, 60] 27401 299 (60, 70] 17901 228 (70, 80] 5865 60 (80, 90] 846 10 <img src="/assets/age_dist.png">
We found a large proportion of data is for age 20 to 75.
The model may perform better for ages age 20 to 75 as that data is more abundant.
On running the model on the test data we found the that in one cases the BodyPartExamined is not chest. Our model should not be used in that case.
Co-morbid distribution of intensities
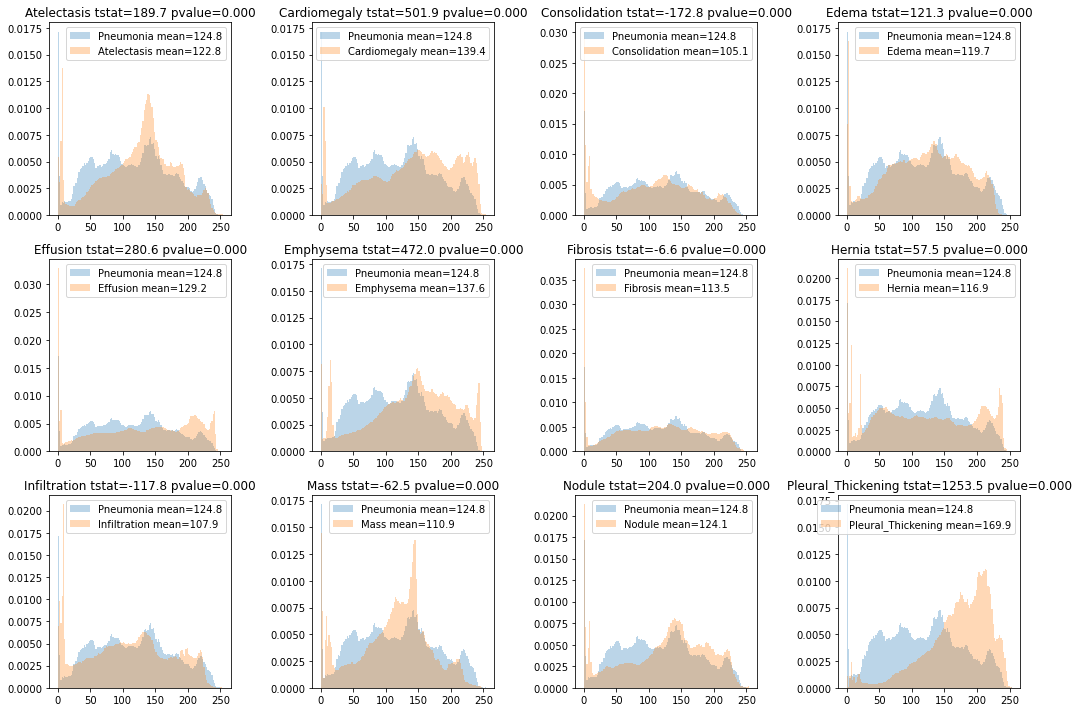
We conducted statistical tests for the difference in intensity distributions of of comorbid diseases with intensity distribution of Pneumonia. The t-test revealed a statistically significant difference between intensities of all dieases with Pneumonia. However, the t-test statistic was the smallest (-6.6) for Fibrosis and the distribution of intensities was also very indistinguishable.
Based on this we can use Pneumonia positive and non-Penumonia together in the dataset. However, we may find a slightly high error in distinguishing between Pneumonia and Fibrosis.
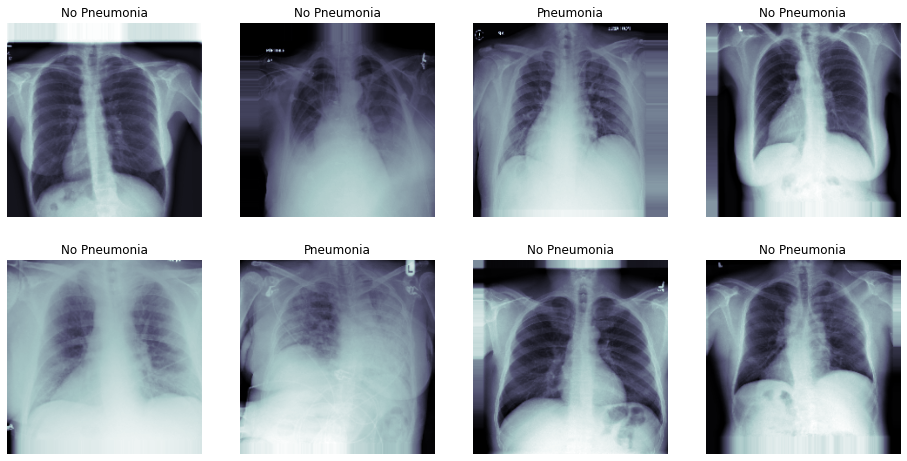
Test data performance:
Running the model on test data the following figure shows how the pre-processed image looks for the valid data. 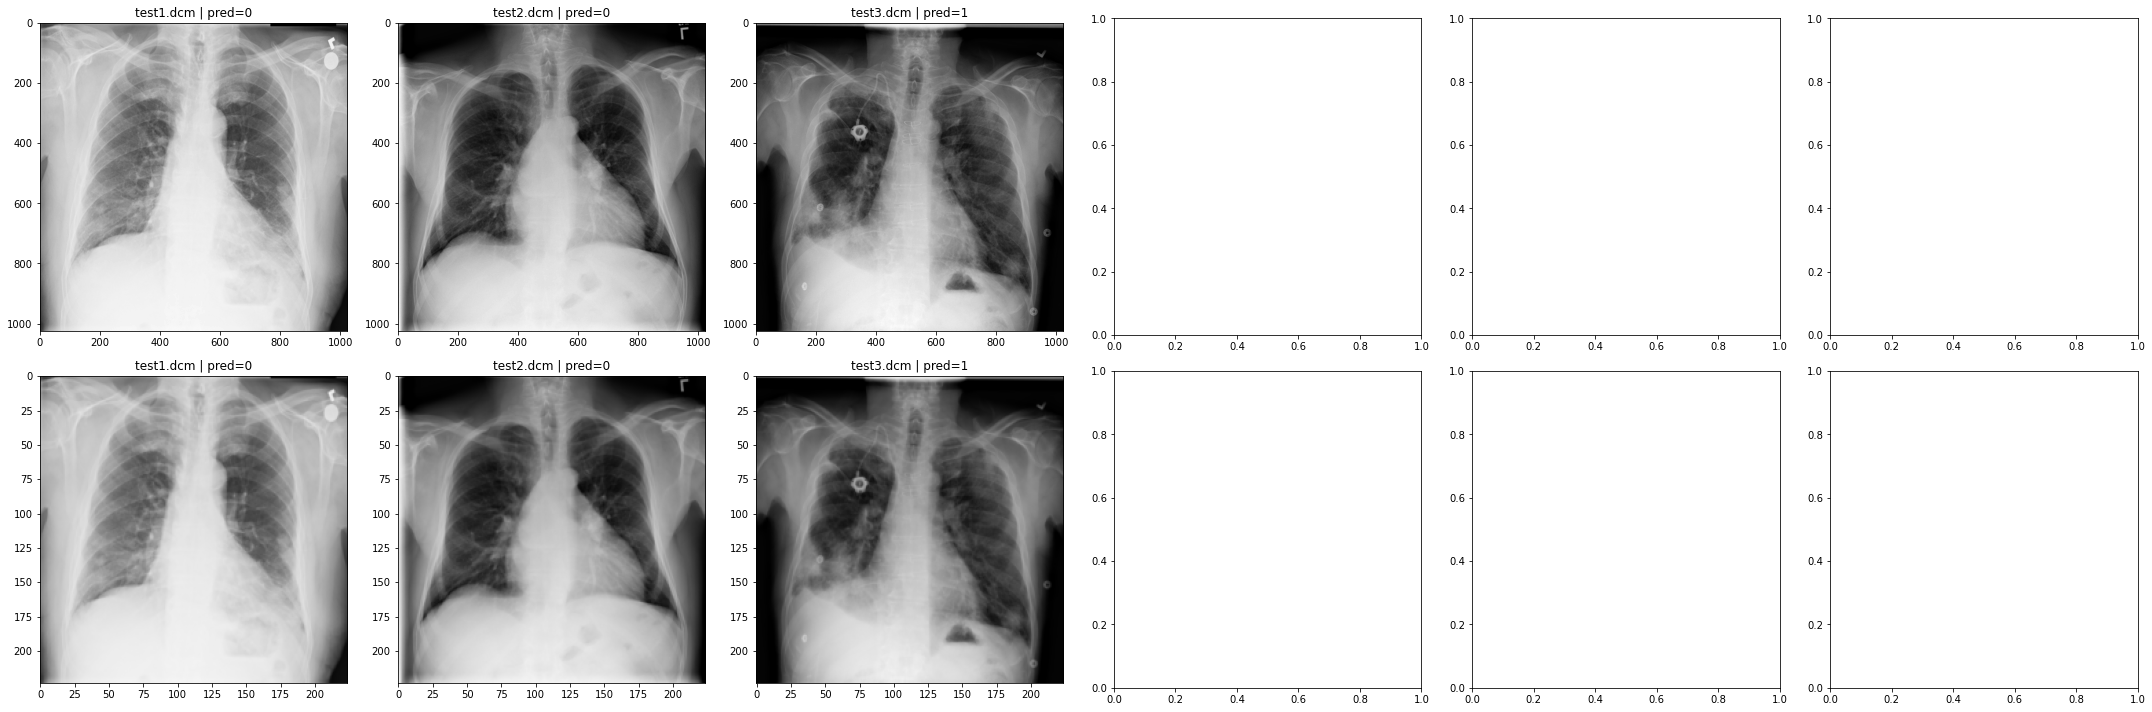
Ground Truth Acquisition Methodology: We can collect more ground truth by collaborating with hospitals and getting final diagnosed datasets e.g. biopsy, which have the true labels as identified by a doctor. This will be the best ground truth which we can get but slightly expensive to acquire. Hence, we can limit the ground truth collection to 100 x-rays per disease. Further, we can also collect silver standard dataset by using a majority vote of radiologist observations as true labels. This can be a robust approach for testing the model while being cheaper to acquire data.
The ideal data should have the following attributes:
- BodyPartExamined ==’CHEST’
- Modality ==’DX’
- PatientPosition ==’AP’ or PatientPosition ==’PA’
Our data has slight skew towards certain age range and gender, and if the real data matches that our model’s performance is going to be similar.
Also, the data should have the prevalance of Pneumonia matching the validation set, this will ensure a correct comparison of results of the model.
Algorithm Performance Standard: Since the scope of the algorithm is to aid radiologists, we need to have high recall while having lower precision. We consider a precision of 40% for a recall around 90% to be our basis. Based on our current threshold we achieve a F1-score of 0.40 or 40%. This F1 score is already higher than the F1 scores by using the labels by averaging four Radiologist labels (see paper Table 1 as reference). Furthermore, F1 score is withing the confidence interval of 0.330, 0.442 of the mean radiologist labels as reported in the same paper.